
|
Data representation |
Data miners have to
be used within a knowledge discovery process consisting:
-
Data cleaning: kill noise data and irrelevant data
-
Data integration:
combine sources to one source
-
Data selection:
throw away the stuff you don't want
-
Data transformation:
get the stuff ready for the leaner
-
Data mining:
learn
-
Pattern evaluation:
think about it
-
Knowledge representation:
show the results to the users.
This project is about the last task- representing the output so
some decision can be made. In this case- what is a good
data miner for continuous classes?
|
|
Due |
Thursday Sept 4
|
|
Marks |
5 marks
Late penalties:
1.5 marks per late day (weekend = 1 day). Late marks begin midnight on the
due date.
|
|
To do |
Your task is to evaluate three different learners.
- LSR; a.k.a. linear standard regression.
This is the sort of thing you can do in EXCEL: try to fit
one straight line through all the points. Pick the line that
has the least sum of squares of errors actual vs predicted.
- RegressionTrees: a data mining method used a lot
in the 1980s. A regression tree forks branches
that minimize variation in the examples in the
sub-branches. The leaves of such trees are the average
value of the examples that fall to the leaves.
- ModelTrees: A modern, more sophisticated
version of regression trees. A tree is learnt that
splits the data N-ways and LSR is called on each of the ways.
(The above explanation is very terse and we'll be studying all
the above, in more detail, later in the term.)
ModelTree learners work like this:
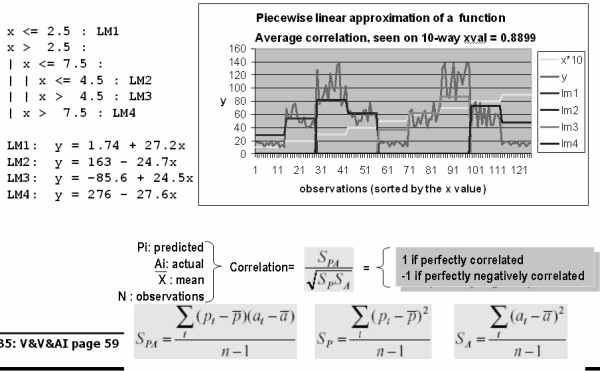
Note that:
- The ModelTree
has divided the function into four zones and called LSR
on each zone.
- The results are measured via a correlation number
(calculation details shown above). The further away from 0,
the better the correlation.
|
|
Hand in |
Hand in a 2 page report (max) describing which learner was
best and (most importantly) WHY you thought so.
Attach to the report appendices showing your awk code,
sample command lines, and the outputs.
Also, taking up to 1 page,
hand in a fully commented version
of the reportM5.awk source code shown here that
extracts the correlation coefficient from an M5 output:
/Correlation coefficient/ {corr=$NF}
END {print corr}
Hint: to understand that one, you'll have to know the format of
a M5 output.
Also, taking up to 2 pages,
hand in a fully commented version
of the m5s source code shown here:
#!/bin/bash
datas=`cat /home/menzies/dm/data/someNumericDatasets.dat`
exe="/home/menzies/dm/bin"
dat="/home/menzies/dm/data"
learn1() {
        $exe/$1 $dat/$2 | gawk -f $exe/reportM5.awk
}
for data in $datas
do
        echo -n $data
        for learner in lsr regressionTree modelTree
        do
                result=`learn1 $learner $data`
                echo -n " $learner $result"
        done
        echo ""
done
Your comments should show me that you understand the
following:
- bash scripting (see this
gentle introduction).
- functions in bash
- positional command line argument
-
variable substitution
- backticks
- why "echo"
sometimes uses a "-n" argument.echo command]
|
|
Details |
Work in groups of two.
Run home/menzies/dm/bin/m5s and trap the output to a file in your
directory
e.g. home/menzies/dm/bin/m5s > $HOME/m5s.out
(Warning, this will take a few minutes to run.)
$HOME/m5s.out will look like this:
auto93    lsr 0.8429 regressionTree 0.6782 modelTree 0.8691
autoHorse lsr 0.9466 regressionTree 0.8899 modelTree 0.9477
autoMpg   lsr 0.9239 regressionTree 0.8957 modelTree 0.9277
autoPrice lsr 0.8873 regressionTree 0.8979 modelTree 0.9232
etc
This shows the correlation of the learnt theories to the actual
data for the data sets shown in column 1.
Write gawk scripts to compare all the reported correlations
to some "goal" column using the following code:
- "+" means that THIS correlation is MORE than the goal correlation.
- "-" means that THIS correlation is LESS than the goal correlation.
- "=" means that THIS correlation is the SAME as the goal correlation
Here, we say that "MORE/LESS" means within some "slack" zone:
function report(thisCorrelation, goalCorrelation) {
  n = abs(thisCorrelation/goalCorrelation)
  if ( n > (1+slack) ) { return "+" };
  if ( n < (1-slack) ) { return "-" };
  return "=";
}
function abs (n) {
  if (n < 0 ) {return -1*n}
  else {return n}
}
For example, if "goal"
is column 5 and the "slack" is 0.01 then the command line
gawk -f m5best.awk goal=5 slack=0.01 $HOME/m5s.out should generate:
what      lsr regressionTree modelTree
auto93    +   =              +
autoHorse +   =              +
autoMpg   +   =              +
autoPrice -   =              +
etc
which means that LSR and ModelTree did better
than RegressionTree learning in 7 of the 8 comparisons
(which is means that RegressionTree learning
is not to be recommended).
Note that the same command, but with a different "goal",
tells us something interesting:
gawk -f m5best.awk goal=7 slack=0.01 $HOME/m5s.out
auto93    - - =
autoHorse = - =
autoMpg   = - =
autoPrice - - =
etc
This means that in no case, did any other learner
out-perform ModelTrees (which
means that ModelTree learning is to be highly
recommended).
|
|
Hints |
Do all your work on ivy- its a faster machine and the JAVA
works right there.
Most of the work here will be in the gawk scripting,
not the learning. So get good with gawk!
My solution is 18 lines long, and that includes the
ten lines of "abs" and "report" shown above.
So if you are writing pages and pages and pages,
then you are writing too much.